Graph all the things
analyzing all the things you forgot to wonder about
Cicadas
2015-01-06
interests: math, contrived population genetics
Some types of cicadas emerge only once every 13 or 17 years. In the chart below, I've estimated the danger level (yellow) for cicadas to emerge with a particular frequency:
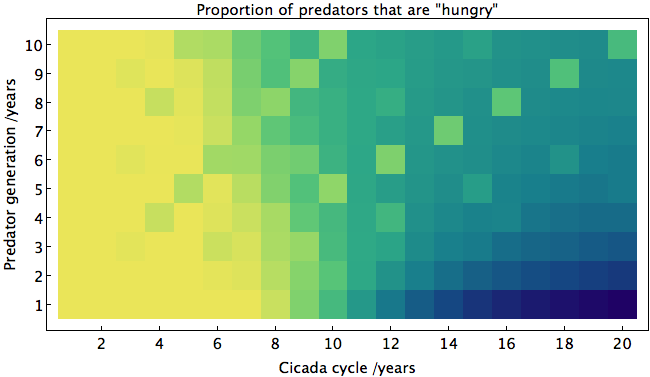
This may help explain why cicadas appear after such unusual numbers of years; the 13 and 17 columns in the chart are uniformly safe from predators, regardless of how long a predator's generation is. Let me break down how I got this result.
Humans
For humans, a generation is roughly 25 years. That means that newborns are somewhat unlikely to have ancestors aged 15, 40, 65, etc. Similarly, those ancestors were unlikely to be have parents aged 15, 40, 65, etc., so could it be that people evolve almost independently of those years older? Of course not: people often have children when they are
not exactly 25, so over time the genetic difference between these
"independent" age groups would blur. That is, the frequencies of
certain alleles (variants of genes) cannot depend on age much.
years older? Of course not: people often have children when they are
not exactly 25, so over time the genetic difference between these
"independent" age groups would blur. That is, the frequencies of
certain alleles (variants of genes) cannot depend on age much.
How quickly would a genetic difference between age groups even out? To make things simple, we need assumptions:
- The only factor in mating chance is age.
- The population size is large and constant.
- Allele frequencies are equal for males and females.
- Migration, mutation, and selection are negligible.
 is
is
 . Then the allele frequency
  among newborns must be
  where
where  is chance for a
child's
parent to be aged , and
is chance for a
child's
parent to be aged , and  and
and  are the minimum and maximum ages
of reproduction. That means that one year in the future, the allele
frequencies will be
are the minimum and maximum ages
of reproduction. That means that one year in the future, the allele
frequencies will be  where
where  . In matrix
terminology,
. In matrix
terminology,

 . Iterating, the population years in advance will have allele frequencies given by
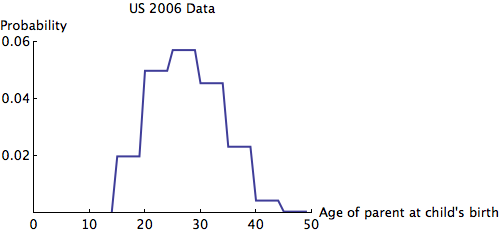
  . I obtained some 2006 data for the top row of from UN data about the US:
The eigenvalues of are at most 1, so we can see that any irregularity in the allele frequencies of age groups quickly dies out. Here is an animation of the slowest possible decay:
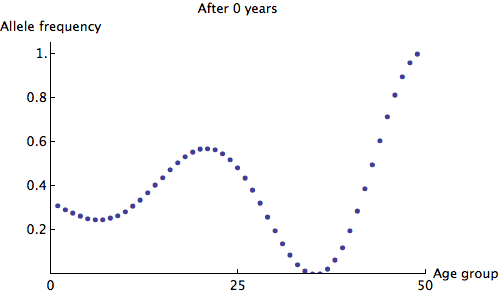
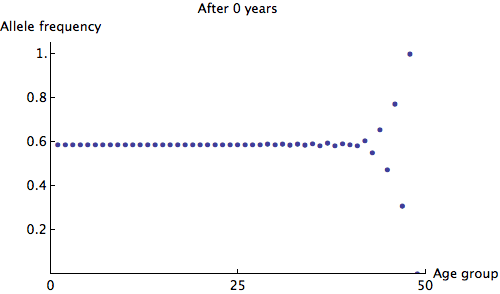
We can see that the allele frequency for all age groups is about the same after 60 years; the rate of decay is  . Just for fun, here's an animation of the fastest possible decay, at the rate of
  :
:
The Ludicrous Cicada
But what if, for some absurd reason, the allele increased fertility rate in some years and decreased it in others? Then perhaps these fluctuations in allele frequency could persist. This is exactly the case for the predators of 13- and 17-year cicadas.
The cicada is an unusual insect which emerges for about 6 weeks only once every 13 or 17 years depending on which brood it is from. Predators can easily catch cicadas, so the only way for a cicada to survive is to hide behind a meat shield of so many other cicadas that the predators get full and leave. Hence the long cycles and short appearances: cicadas could not survive this onslaught all year round.
It is also interesting that the cicadas emerge after a prime number of years. The textbook justification is that such cycles prevent predators from "predicting" the cicada's emergence. Of course the predators don't consciously keep track of this - birds rarely even live to 13 years. However, suppose there were a "hungry" allele that made a predator reproduce more at the cost of needing more food. This trait would be beneficial in cicada years and harmful when food is less abundant. If cicadas emerged every 12 years and the predator species had generations of 6 years, then one of the generations of predators may indeed evolve independently of the others; in the 0th year, many "hungry" birds would feast on cicadas and mate, increasing the "hungry" allele frequency for the birds that mate in the 6th year. Those birds in the 6th year would produce the birds which mate in the 12th year, many of which would be "hungry" and reproduce more because of the cicada feast.
Simulation
This motivates us to change our first assumption from before: mating chance now depends only on age, allele type, and year. Otherwise, our assumptions are still mostly valid. The one anomaly is that, as Koenig and Liebhold showed, bird populations actually drop in cicada years - an unexplained phenomenon.
I estimated some data for a predator's chance of reproduction given these factors, assuming the "hungry" trait is recessive, cicadas come out every 12 years, and the predators have 6-year generations with standard deviation 0.5. I supposed that "hungry" predators might reproduce 0.9 times as much as ordinary predators in normal years, but 2.1 times as much in cicada years. Since fertility depends on allele, we can no longer simply use matrices to analyze this scenario. Instead, simulation shows what the allele frequency approaches after 1000 years of gluttony:
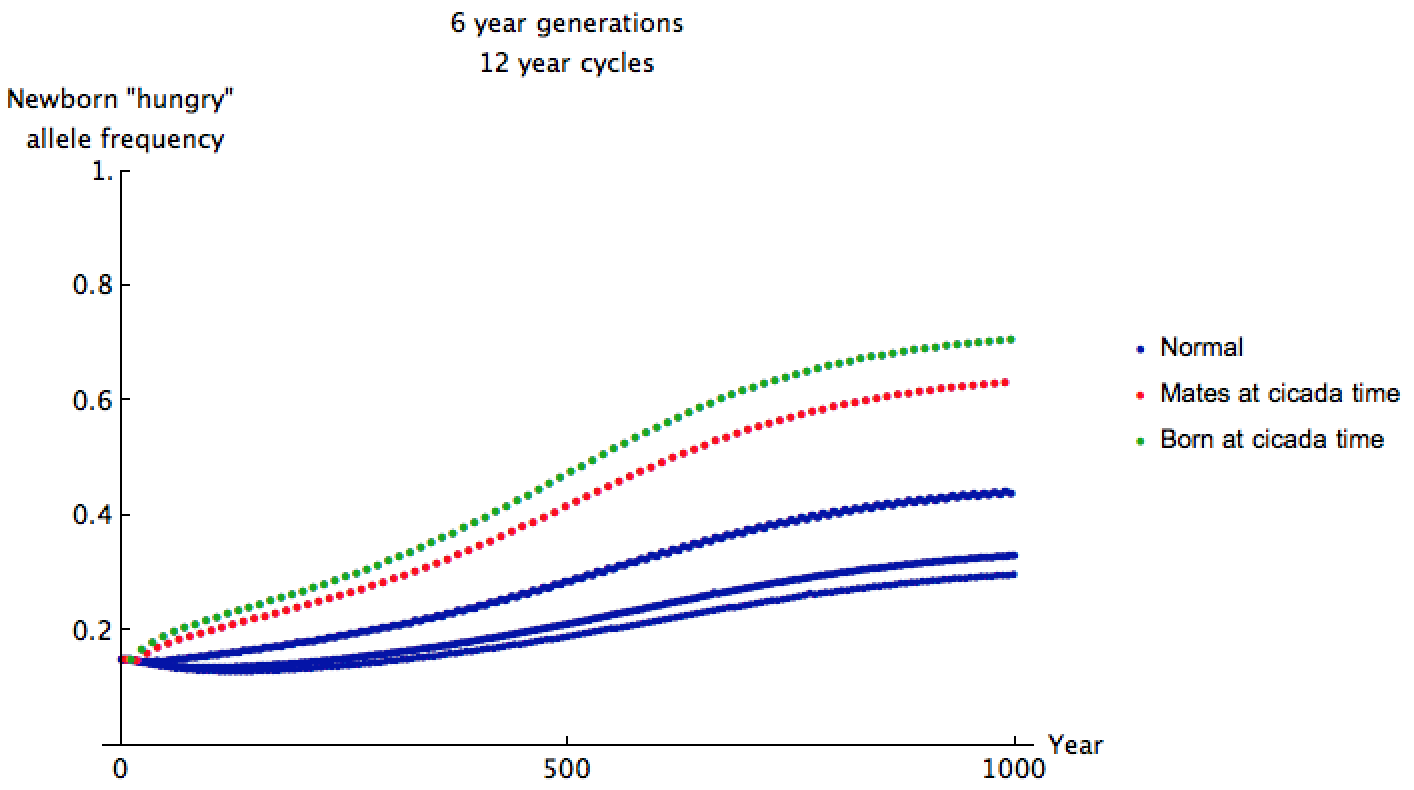
When cicadas come out, the "hungry" allele frequency in mating predators is given by one of the red dots above. As time goes on, the allele frequency for these predators approaches about 0.64. This frequency is higher than that of most predators born at other times since the 6-year-old predators' ancestors feasted and reproduced just 12 years ago. If  are the allele frequencies in the most recent years, we can estimate the proportion of predators which actually exhibit the recessive trait as

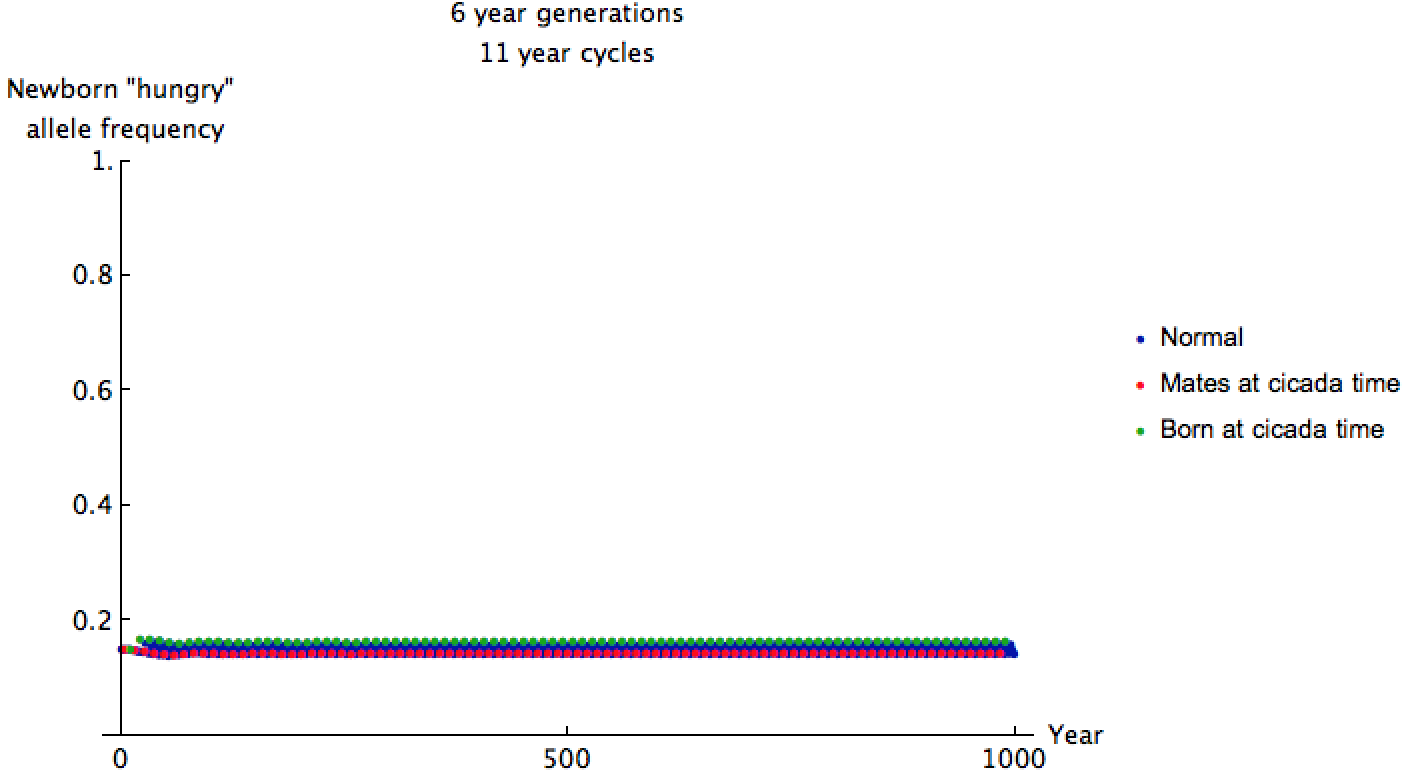
I started the allele frequency close to equilibrium here because cicada and predator cycles sync up only once every 66 years, making convergence to equilibrium very slow. The allele frequencies are shockingly less than before, but we can glean more information by zooming in:
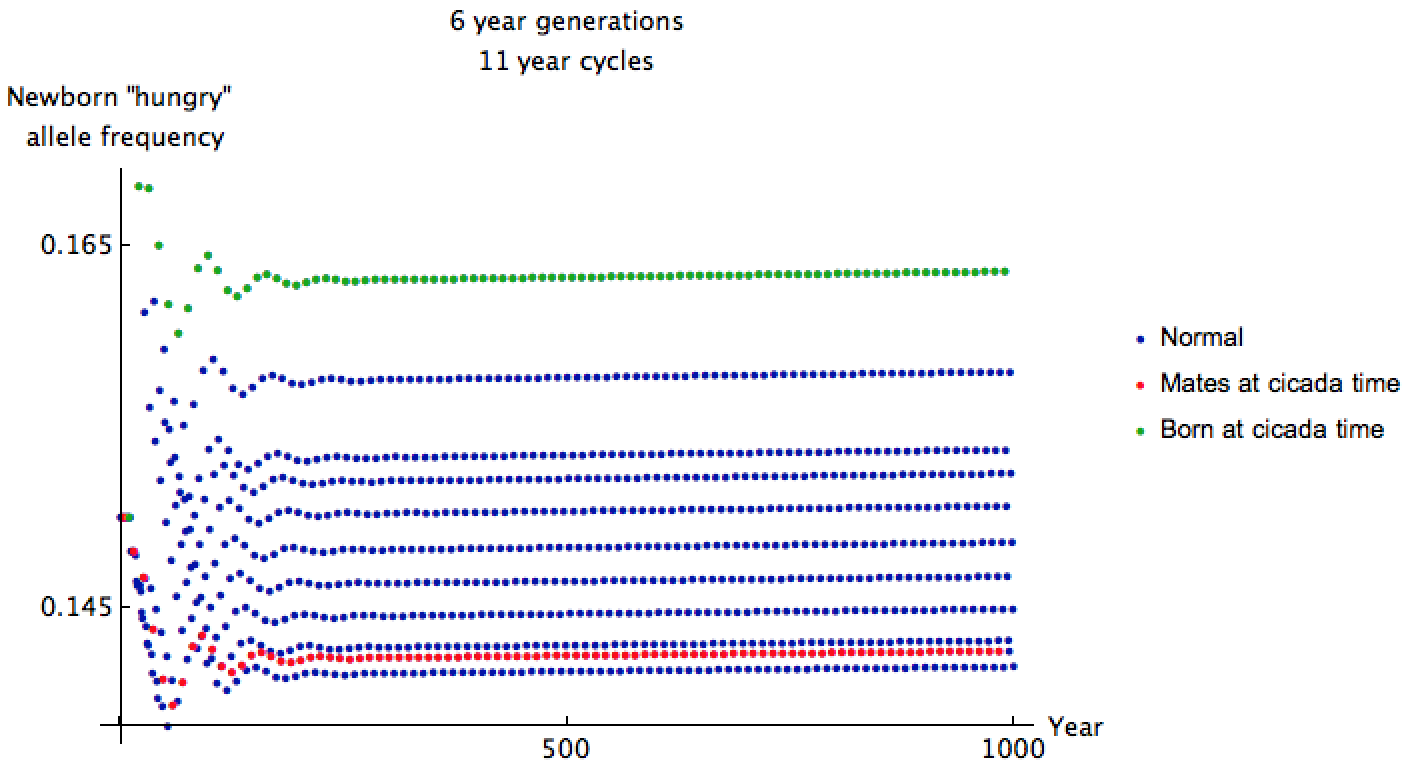
The mating predators have relatively low "hungry" allele frequency of 0.146 when cicadas come out. It has been 66 years since many of their ancestors encountered cicadas and reproduced, so this makes sense. Even though the cicadas emerge more frequently in this setup, their predators are less ravenous, and only 2.4% exhibit the recessive "hungry" trait.
Since 11 is prime, we should expect somewhat similar results if predators have generations of any other duration. To show this (and more), I made a heat map of the average proportion of predators with the "hungry" trait after 1000 years for various durations of predator generations and cicada cycles:
Yellow corresponds to a high proportion of predators with the trait. One curious thing about this graph is the low number of "hungry" predators where predator generation and cicada cycles are small and equal. For instance, at (4,4), the predators that eat cicadas and mate in the same year evolve somewhat independently of the other predators, meaning that the others need not develop the particular allele. The opposite happens for larger cycles. The danger level shoots up when the cicada's cycle is exactly twice that of the predator, and increases moderately when the cycles share a factor of 4, 5, or 6.
Since predators may have various life cycles, it is probably safest for the cicadas to emerge when with cycles such that no predator can take advantage of them. The best such cycles (for these parameters, in order) are 19, 17, 13, 15, 11. As expected, they are mostly prime, and none are multiples of 2. This is likely one of the reasons why cicadas emerge every 13 or 17 years.
Sources
"World Fertility Data 2008." United Nations. http://www.un.org/esa/population/publications/WFD%202008/WP_WFD_2008/Data.html
Koenig, Walter D., and Andrew M. Liebhold. "Avian predation pressure as a potential driver of periodical cicada cycle length." The American Naturalist 181.1 (2013): 145-149.