Graph all the things
analyzing all the things you forgot to wonder about
Review Doping
2015-12-05
interests: online reviews (skim for the results), statistics
If you're like me, you don't usually leave a review online with your exact opinion. Instead, you leave a review to move the average review in the direction you want. For instance, if I see a restaurant on Yelp I think deserves 4 stars but only has 3 stars, I am likely to give a 5 star review to move the average closer to what I believe. Similarly I might give a 1 star review to a restaurant I think is overrated.
I'll call this tactic "review doping". Review doping certainly sounds bad, but how does it actually affect the average review? And is it prevalent?
The answers are that it tends to moderate the average reviews in most cases, but that not terribly many people seem to be doing it. So perhaps I'm just unusual.
How review doping changes the mean
Let's assume:
- Each person's true opinion about what the rating should be is a random variable drawn from the same (time-invariant) distribution.
- Everyone review dopes.
- Every review is on a continuous scale from 0 to 1.
 th person's true feeling about the product be
  so that they leave a review of
  . The mean review after votes will then be

 as
as  in terms of the distribution of
  's. Since this limit exists, let's consider a very large value of so that each reviewer is almost certain to review either 0 or 1 to sway the average review as much as possible. In this case, the expected value of
  is
is

 will be 0 if the
  st person thinks the review should be lower, and 1 otherwise, so


 is the equillibrium doped mean, then this average change between votes must be 0, given our large assumption:


 , given the distribution of 's. We can simplify it slightly further since
  and
and  . Plugging these in gives

But what does that mean actually mean?
This can be read as "a proportion  of the reviewers think the average review should be less than ". For example, if
  , then the 20th percentile reviewer thinks the review should be 80%. If
  , then the median reviewer thinks the review should be 50%.
Here are some example probability distributions for the reviewers' true opinions in green, and the true mean and doped mean in blue and red.
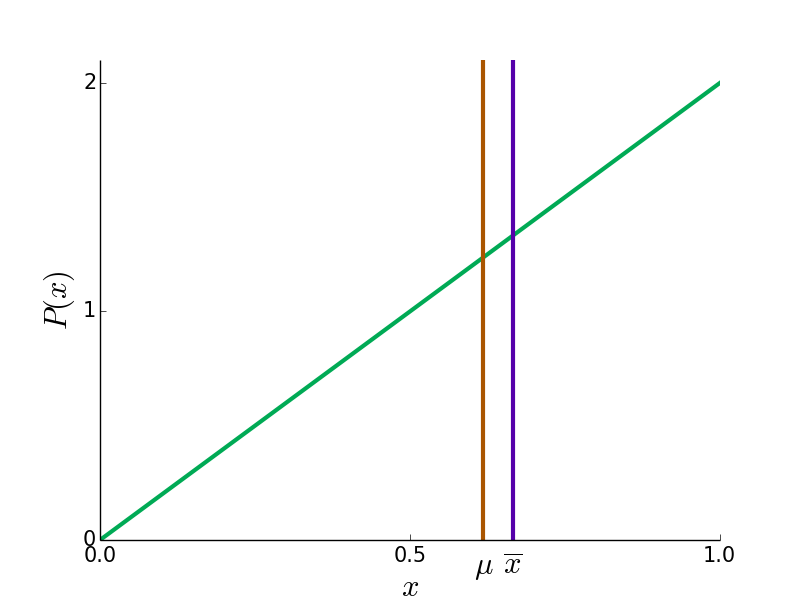
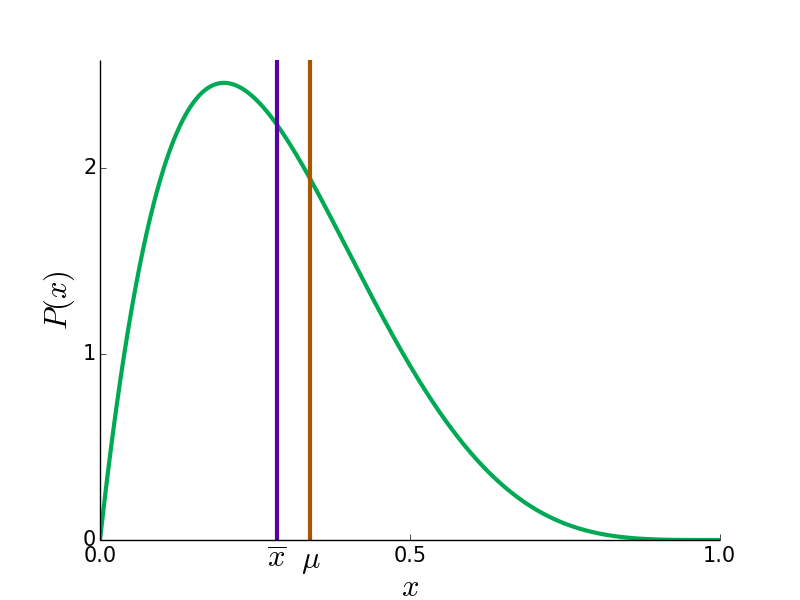
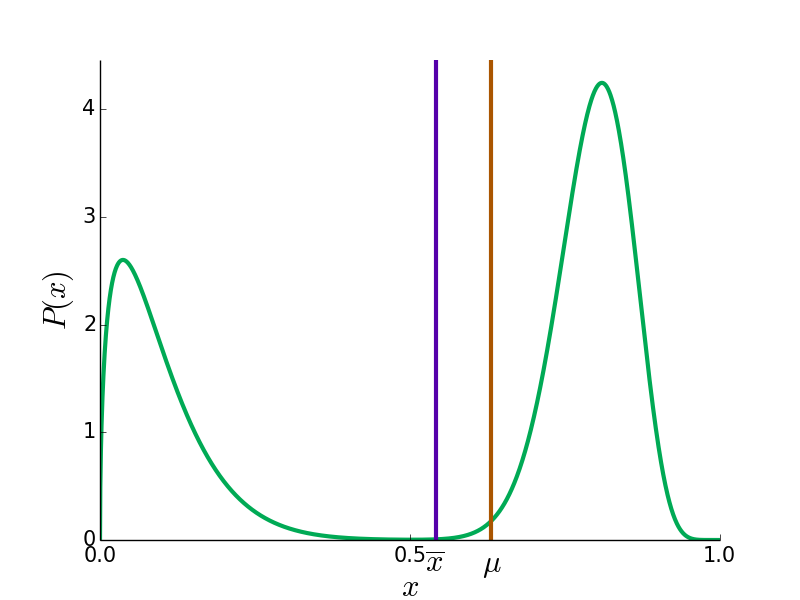
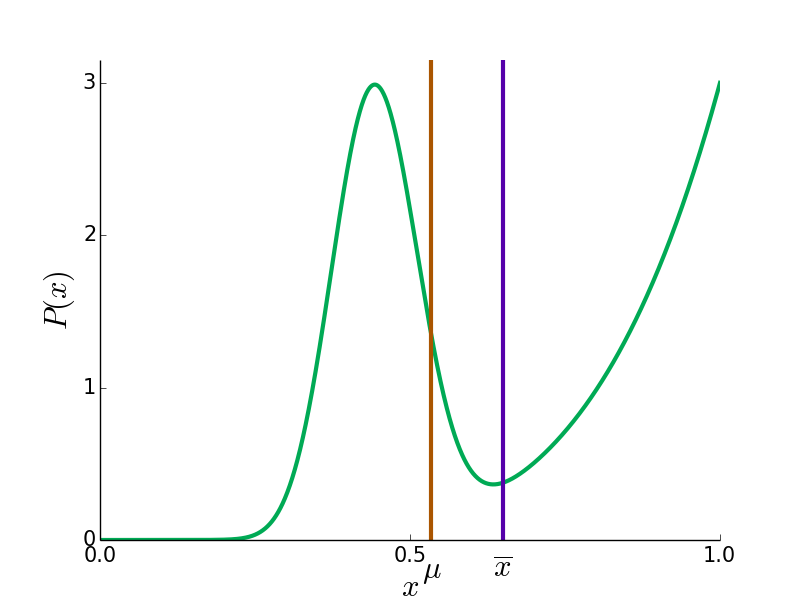
In most cases, is closer to 0.5 then  since the reviews of the contrarian faction move more (by voting 0 when
  , for instance). However, in bizarre cases like the bottom right, can be more extreme than .
But do people actually do this?
Not a whole lot. I analyzed Yelp's academic dataset for two statistics that might show evidence of this trend, but neither did. For both statistics I looked at the first 40 reviews of all businesses with at least 40 reviews.
The first statistic was the correlation between and . If people review like me, they should be more more likely to give low when the they see is positive, and vice versa. In other words, the correlation should be negative. Because of regression toward the mean, this correlation should actually be slightly negative ( ) on average anyway, but doping would make the correlation even lower.
However, the correlation was higher than this due to time-based effects. Very often the initial reviews of the business are higher than later ones, so both  and are decreasing sequences with positive correlation. I did investigate the businesses which seem to have the most negative correlations, and the most extreme in the dataset is possibly the Golden Gate Hotel and Casino in Las Vegas - according to both the ratings and text of the reviews, many on both ends of the spectrum are responding to the hotel's rating and want it to be different. Since this is the most extreme case, though, it is almost certainly a statistical anomaly.
The second factor I looked at was the distribution of reviews as the number of reviews increases. If people are review doping, they will be more likely to review extremely as the number of reviews increases. Here's a plot of the review distribution as a function of review count:
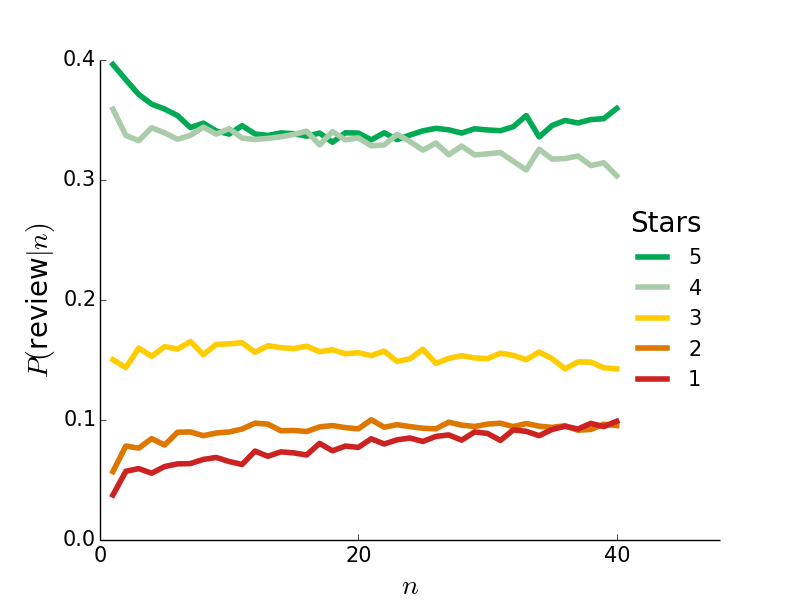
There is a hint that later reviews are more polarized (more 1 star reviews and fewer 3 and 4 star reviews), but certainly no evidence that more than 5% of a restaurant's first 40 reviews are doped. If everyone were like me, the vast majority (probably about 96% by a back-of-the-envelope calculation) of reviews would be either 1 or 5 by that point. Thank goodness they aren't, though - I get more voting power this way.