Graph all the things
analyzing all the things you forgot to wonder about
Interpolation on a Sphere
2015-03-22
interests: math, geometry
We can interpolate between points on a sphere, meaning that, given the value of a function (such as temperature) at various points on a sphere (such as Earth), we can estimate the temperature between those points. For instance, here is an interpolation based on the temperatures in Bangalore, Beijing, and Moscow today, where orange is warm and blue is cold:
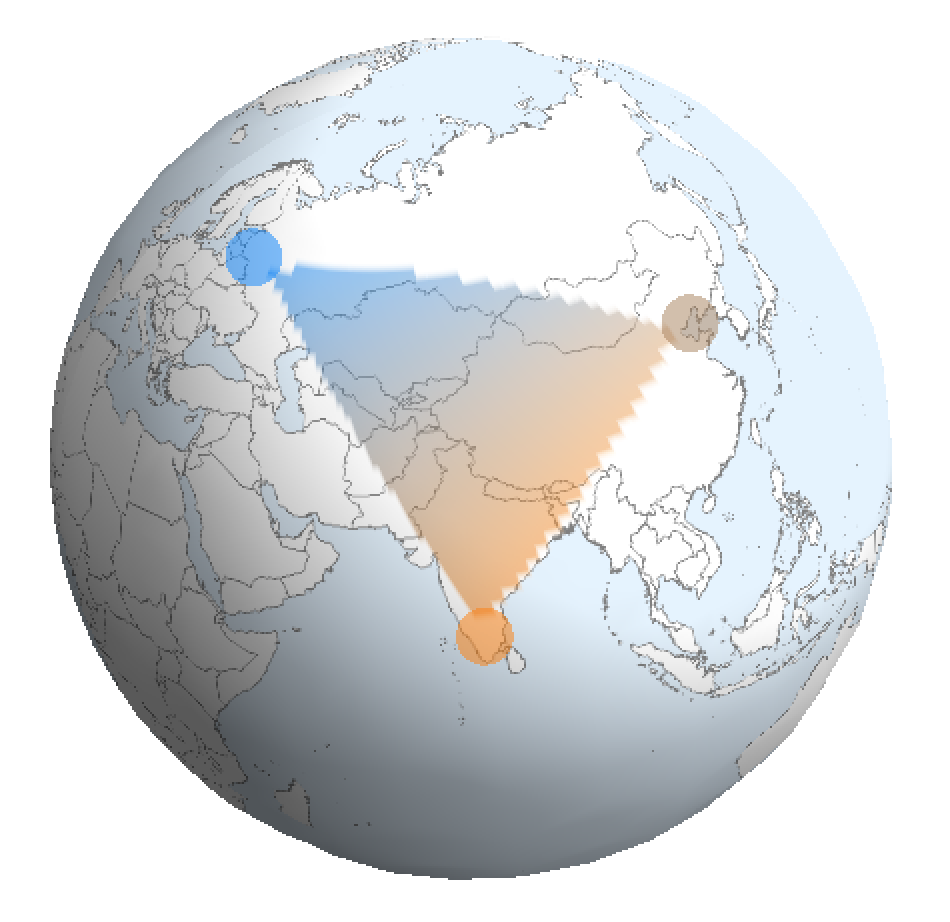
From geometry, we can derive an elegant method to do this to a region on a sphere. Using graph theory and enough points, we can extend this to the whole sphere (in the next post).
The Idea
Here's the temperature today in a few cities:
| City | Temperature (Celcius) |
| Bangalore | 23 |
| Beijing | 11 |
| Moscow | -12 |
You want to estimate the temperature in Islamabad using this information - you're a bit crazy like that. You probably already know how to do linear interpolation on the temperature between two points on a one-dimensional line: if you know  and
and  , then you can estimate
  for
for  by
by

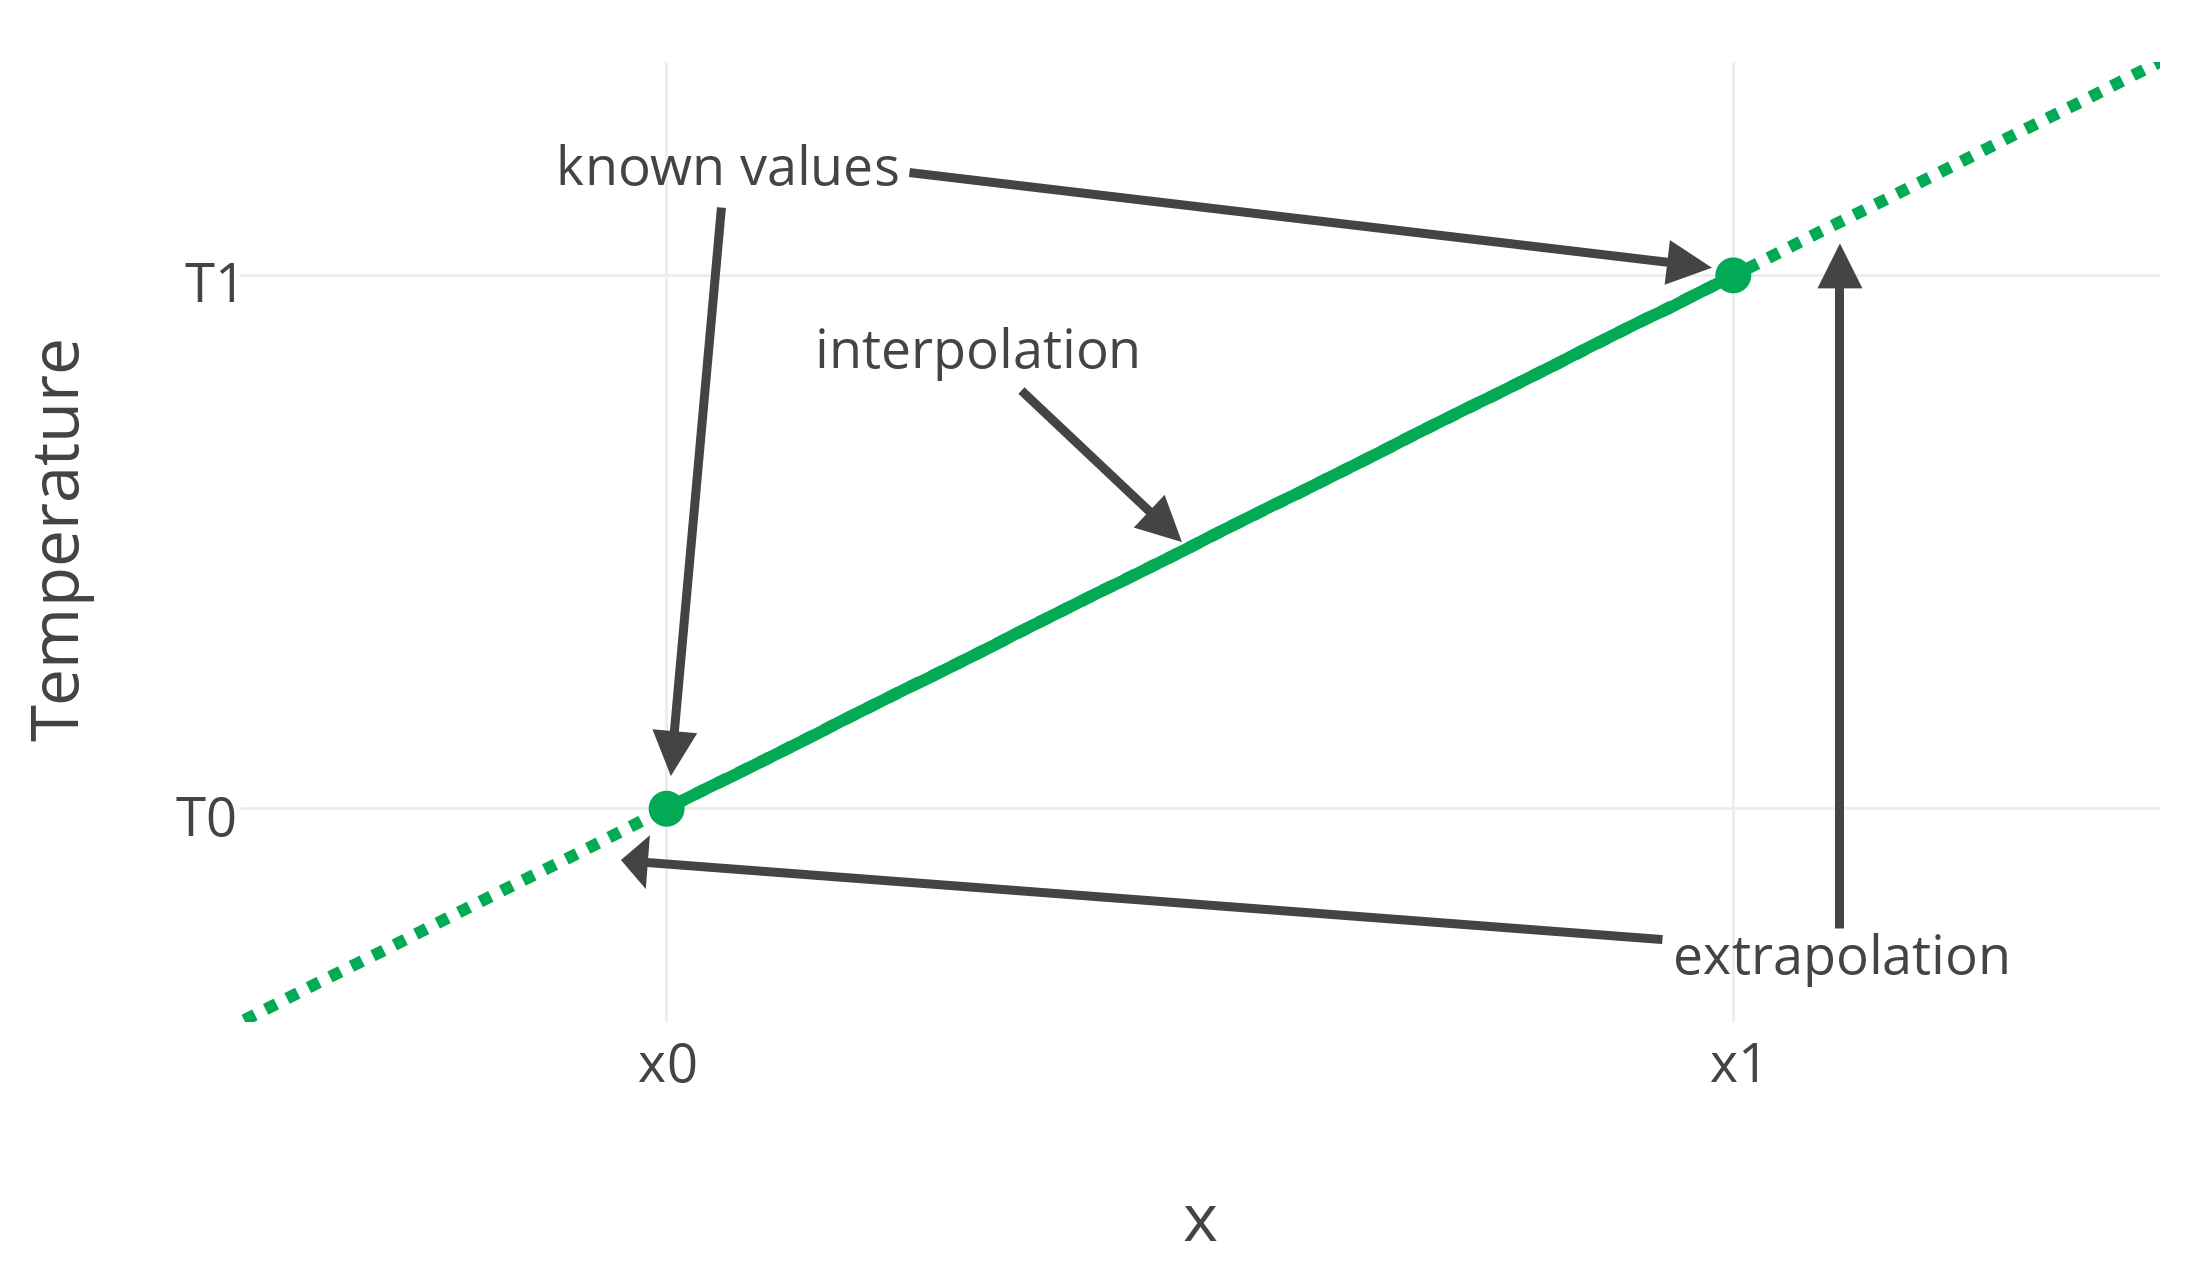
But how would you interpolate the temperature between these cities? On a surface like the Earth, the answer isn't so obvious. Not only are we working in two dimensions (latitude and longitude), but the Earth is also curved. I'll show a beautiful way to perform a "linear" interpolation on a sphere.
Planar Geometry
We can generalize our result on the line to two dimensions. Let's say you know the temperature at points  and want to estimate it at
  within triangle
  :
:
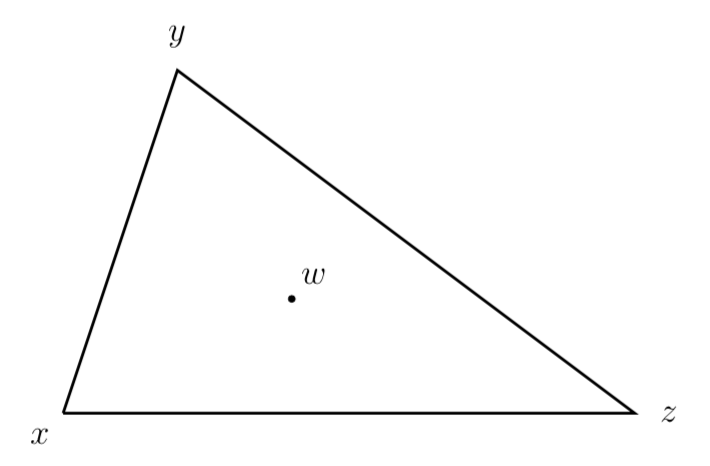
We want to estimate the temperature at by  for some coefficient
  with
with  ; some mixture of the temperatures. It actually easiest to think of this in vector form, shifting the origin to be where
  is:
is:
Intuitively, the coefficients for our mixture of temperatures should satisfy  , leaving
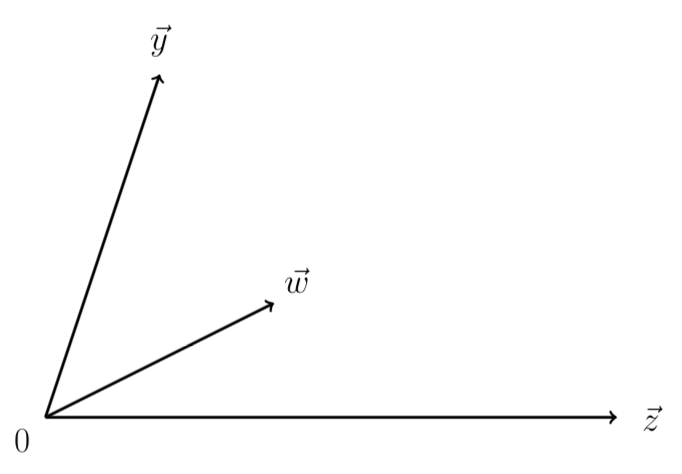
  . This seems simple enough, but there is a more convenient way to write this in terms of the areas of triangles in the following figure:
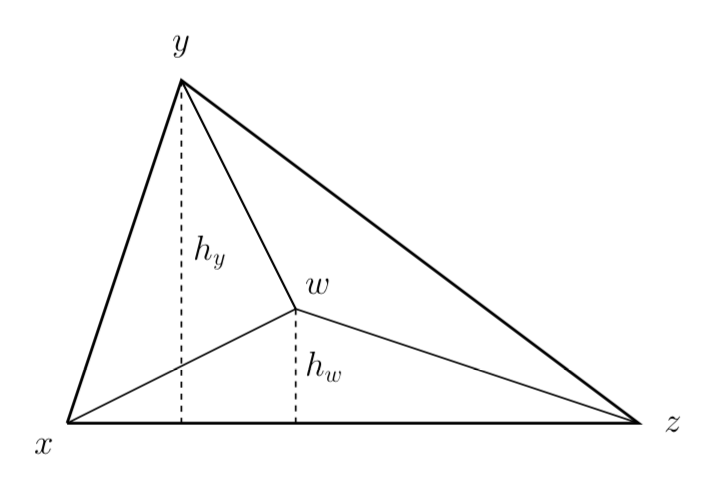
Using our vectors from before, the area of  is
is


 's vertical component
  is just
  (since
  and
and  is entirely horizontal). This gives


 is proportional to the coefficent
  by a ratio equal to the the area of the whole triangle .
Spherical Geometry
We can actually reduce the problem of interpolating on a sphere to the problem of interpolating on a plane. This is tricky, since there is no such things as a linear function on a sphere - we can only hope for a function which is locally linear. Our previous argument using vectors also breaks down, since following vectors on a sphere in a different order gives a different endpoint. It turns out the best solution is to project everything onto a plane perpendicular to the vector (drawn from the sphere's center) we want to interpolate at:
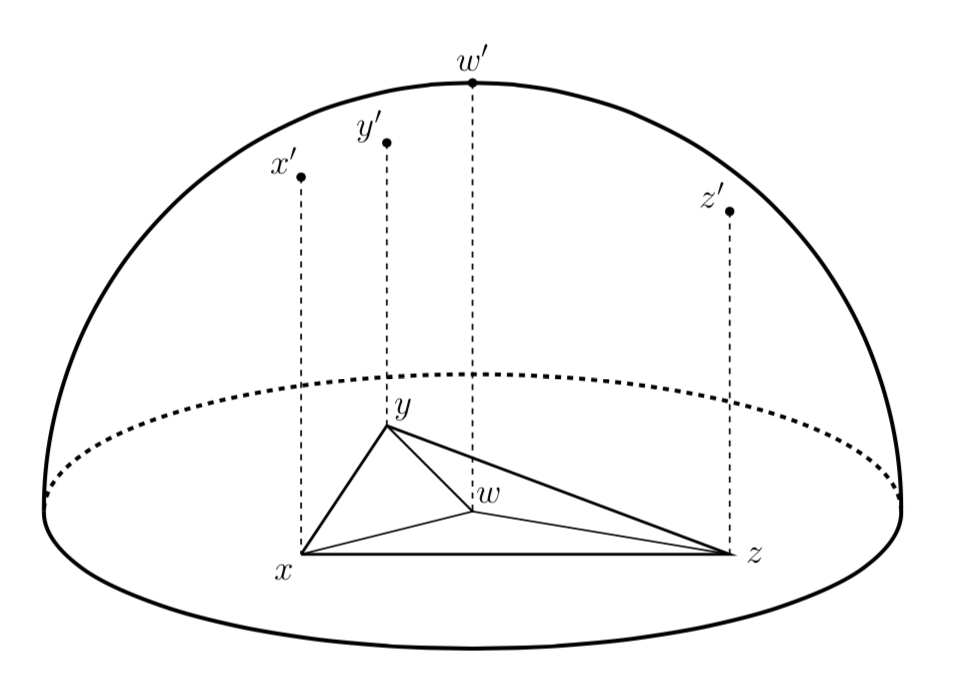
Here we have positioned the plane at the base of the hemisphere so that the projected point is the center of the sphere and the origin. At this juncture, one might despair because actually calculating the projection and evaluating areas from it would be tedious. But fear not: there will be a deus ex machina, and that machina is the determinant. If we take three vectors such as  (in 3-space, drawn from ) and stuff them into a matrix (as its columns), the determinant
  of that matrix is very special. Its magnitude is
  where
where  is the volume of the tetrahedron formed by
  and
and  . Its sign indicates whether
  are in counterclockwise order or not, which is a useful fact I will get to in my next blog post.
Anyway, the volume of a tetrahedron is actually extremely useful. You may recall from geometry class that  where
where  is the base's area and
  is the height. From its projection onto the plane, we can choose
  and
and  , we get


 - a very simple task.
Result
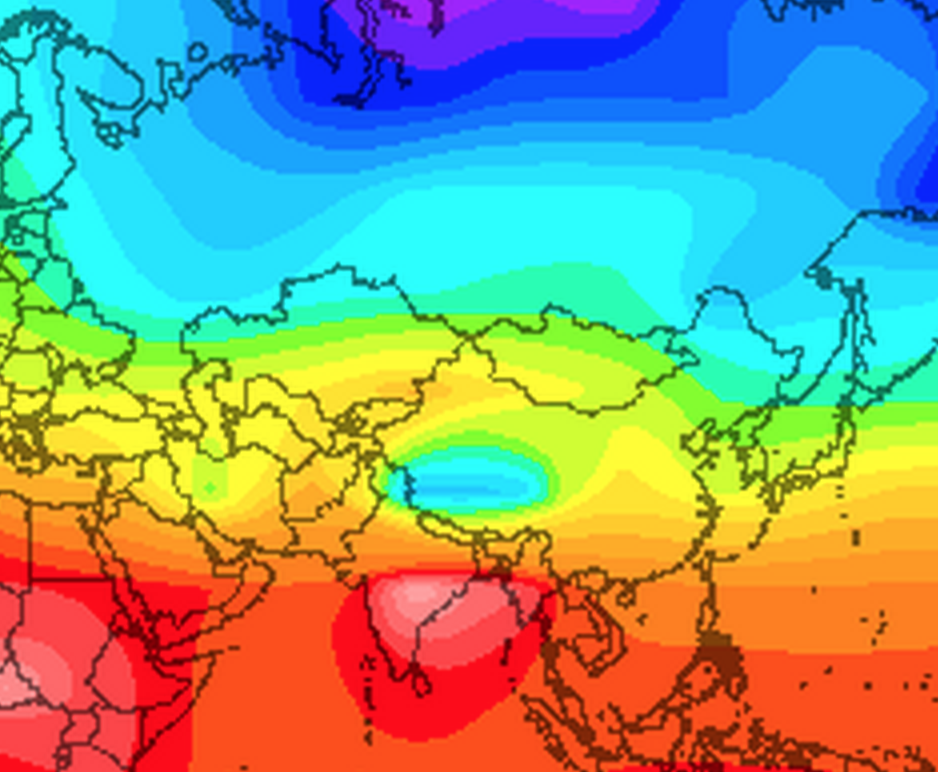
Using this calculation, we estimate that the temperature in Islamabad is a mixture of 51% that of Bangalore, 14% that of Beijing, and 35% that of Moscow, for a result of 9 C. We can also plot the result of this interpolation:
The actual temperature there is 15C, which is pretty close (lucky) considering that temperature can vary unpredictably across just a few hundred kilometers. To accurately estimate the temperature using this method, we would need to measure it it many more points; apparently NOAA uses something like 1500 weather stations around the globe. By the time I finished writing this, temperatures had changed slightly, but here's a real heat map of Asia:
I'll show one way to interpolate with very many known points in my next post.